
Dashboard of COVID-19 cases. 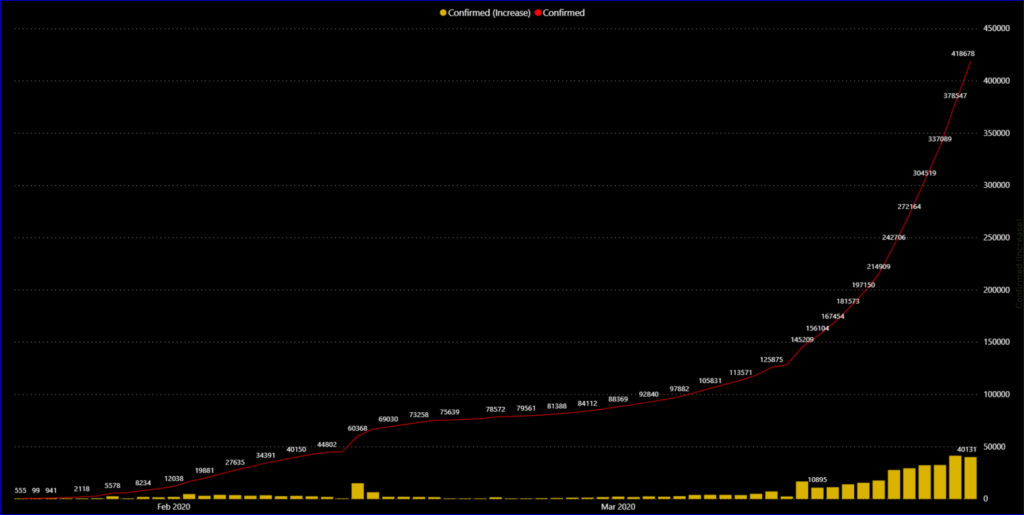
Progression rate. 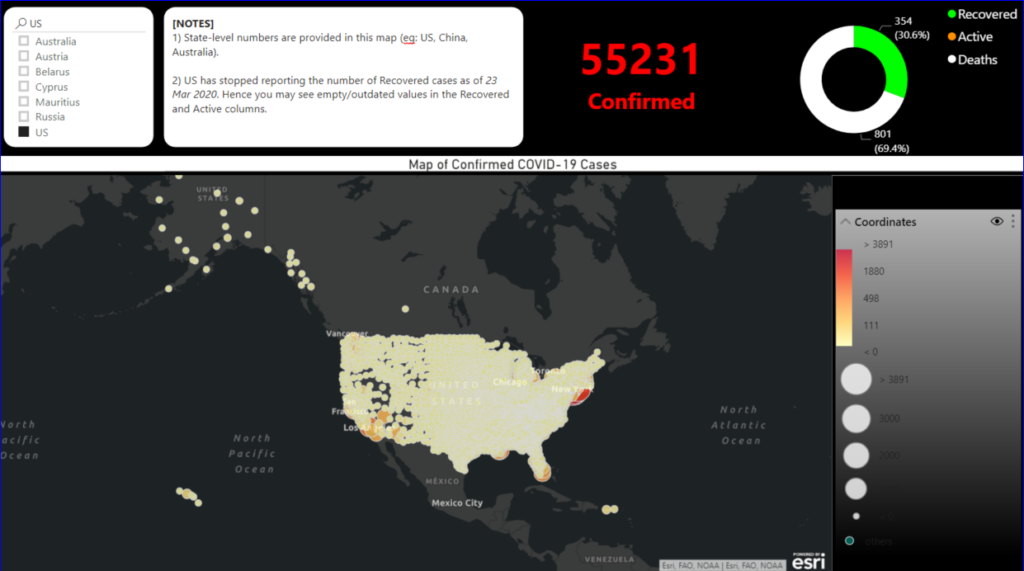
State-level details.
Dashboards illustrating the spread of the COVID-19 virus are springing up around the internet, almost as fast as the virus itself. Hence I thought it’d be an appropriate time to exercise my dashboarding skills and create one too.
This dashboard was created purely using Power BI, with no data wrangling using Python. Credit must go to the excellent web-scrapped data feeds from John Hopkins University (JHU). See their repository here at (…